Stack Traces: Unveiling Attack Surface
How to find, trigger, and weaponize stack traces during black-box recon — from dorking and Shodan to malformed requests, framework fingerprinting, and exploitation paths.
Originally published on Medium.
In black-box testing, we do not have access to source code. However, applications often expose far more than intended due to improper error handling . In this article we will be discussing how to find/cause Stack Trace errors to help with reconnaissance and how to use them to uncover vulnerabilities .
Improper error handling can allow us to:
- Understand the APIs being used internally.
- Map the various services integrating with each other by gaining insight on internal systems and frameworks used, which opens up doors to attack chaining.
- Gather the versions and types of applications being used.
- DoS the system by forcing the system into a deadlock or an unhandled exception that sends a panic signal to the engine running it.
- Controls bypass where a certain exception is not restricted by the logic set around the happy path.
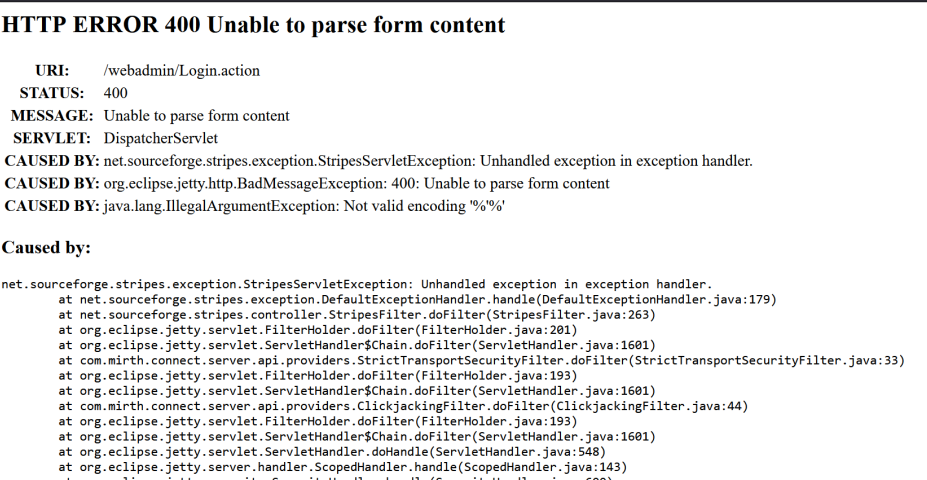
Example of a Stack Trace
**What is a stack trace in simple terms? **It’s a list (or “trace”) of the function calls the program made right before it hit an error, showing exactly where the problem happened.
Stack Traces are a form of information disclosure . Although generally considered as informative/low severity findings they can be the lead to critical vulnerabilities .
Where do we find stack trace errors?
Sometimes we do not have to cause the stack trace errors , they are just there by default ,because the app is not built properly all it take is some Passive Recon, but other times we have to actively cause them , and if the app doesn’t follow best practices for Improper Error Handling , it spits out informations it shouldn’t .
Passive Discovery of Stack Traces
1- Dorking
one of the ways to discover stack traces is through dorking , which help us find common known errors like “sql syntax error” or “Traceback”
Examples
SQL errors :
site:target.com intext:"sql syntax near" | intext:"syntax error has occurred" | intext:"incorrect syntax near" | intext:"unexpected end of SQL command" | intext:"Warning: mysql_connect()" | intext:"Warning: mysql_query()" | intext:"Warning: pg_connect()" intext:"sql syntax near" | intext:"syntax error has occurred" | intext:"incorrect syntax near" | intext:"unexpected end of SQL command" | intext:"Warning: mysql_connect()" | intext:"Warning: mysql_query()" | intext:"Warning: pg_connect()"leaked logs :
site:example.com ext:logError Status codes (4xx,5xx) :
using Shodan or Fofa
- Shodan
# Generic stack traces
http.html:"Exception in thread"
http.html:"Stack trace"
http.html:"Traceback (most recent call last)"
http.html:"Unhandled Exception"
http.html:"Fatal error:"

# Java / Spring
http.html:"java.lang."
http.html:"org.springframework"
http.html:"Caused by:"
http.html:"Whitelabel Error Page"

# PHP
http.html:"PHP Fatal error"
http.html:"Undefined index:"
http.html:"Call to undefined function"

# .NET
http.html:"Server Error in '/' Application"
http.html:"System.NullReferenceException"
http.html:"System.Web"

# Node.js
http.html:"TypeError:" http.html:"at Object."
http.html:"Cannot read property"

# Python
http.html:"Traceback (most recent call last)"
http.html:"Werkzeug Debugger"
http.html:"Django Debug Toolbar"

# HTTP status errors
http.status:500
http.status:502
http.status:503
http.status:504

# Target-specific (example.com)
hostname:"example.com" http.html:"Exception"
hostname:"example.com" http.status:500
- FOFA
# Generic
domain="example.com" && (body="Exception" || body="Stack trace" || body="Traceback")

# Java
domain="example.com" && (body="java.lang." || body="Caused by:")

# PHP
domain="example.com" && (body="PHP Fatal error" || body="Undefined index")

# .NET
domain="example.com" && (body="Server Error in '/' Application" || body="System.")

# Python
domain="example.com" && body="Traceback (most recent call last)"

# Debug pages
domain="example.com" && (body="Whitelabel Error Page" || body="Werkzeug Debugger")

# Status-based
domain="example.com" && status_code="500"
2- Debug pages
sometimes simply adding a parameter like Debug=true in the body or as a url parameter unveils some interesting stuff
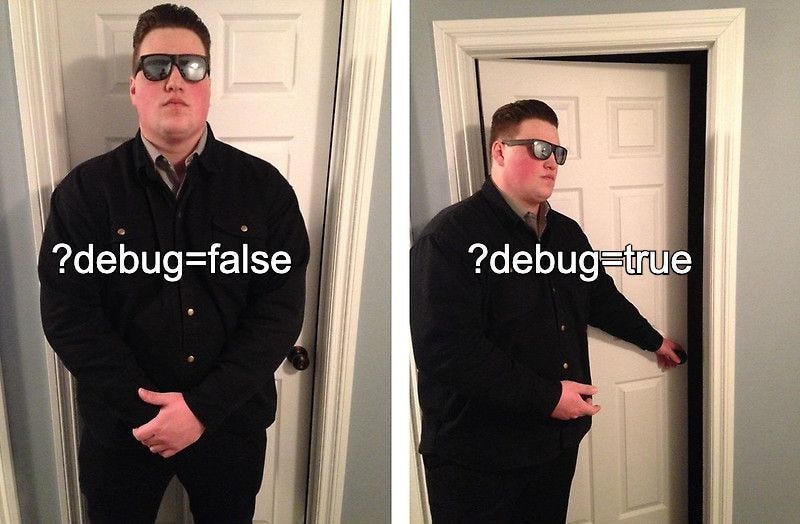
?debug=true
?debug=1
?env=dev
?dev=true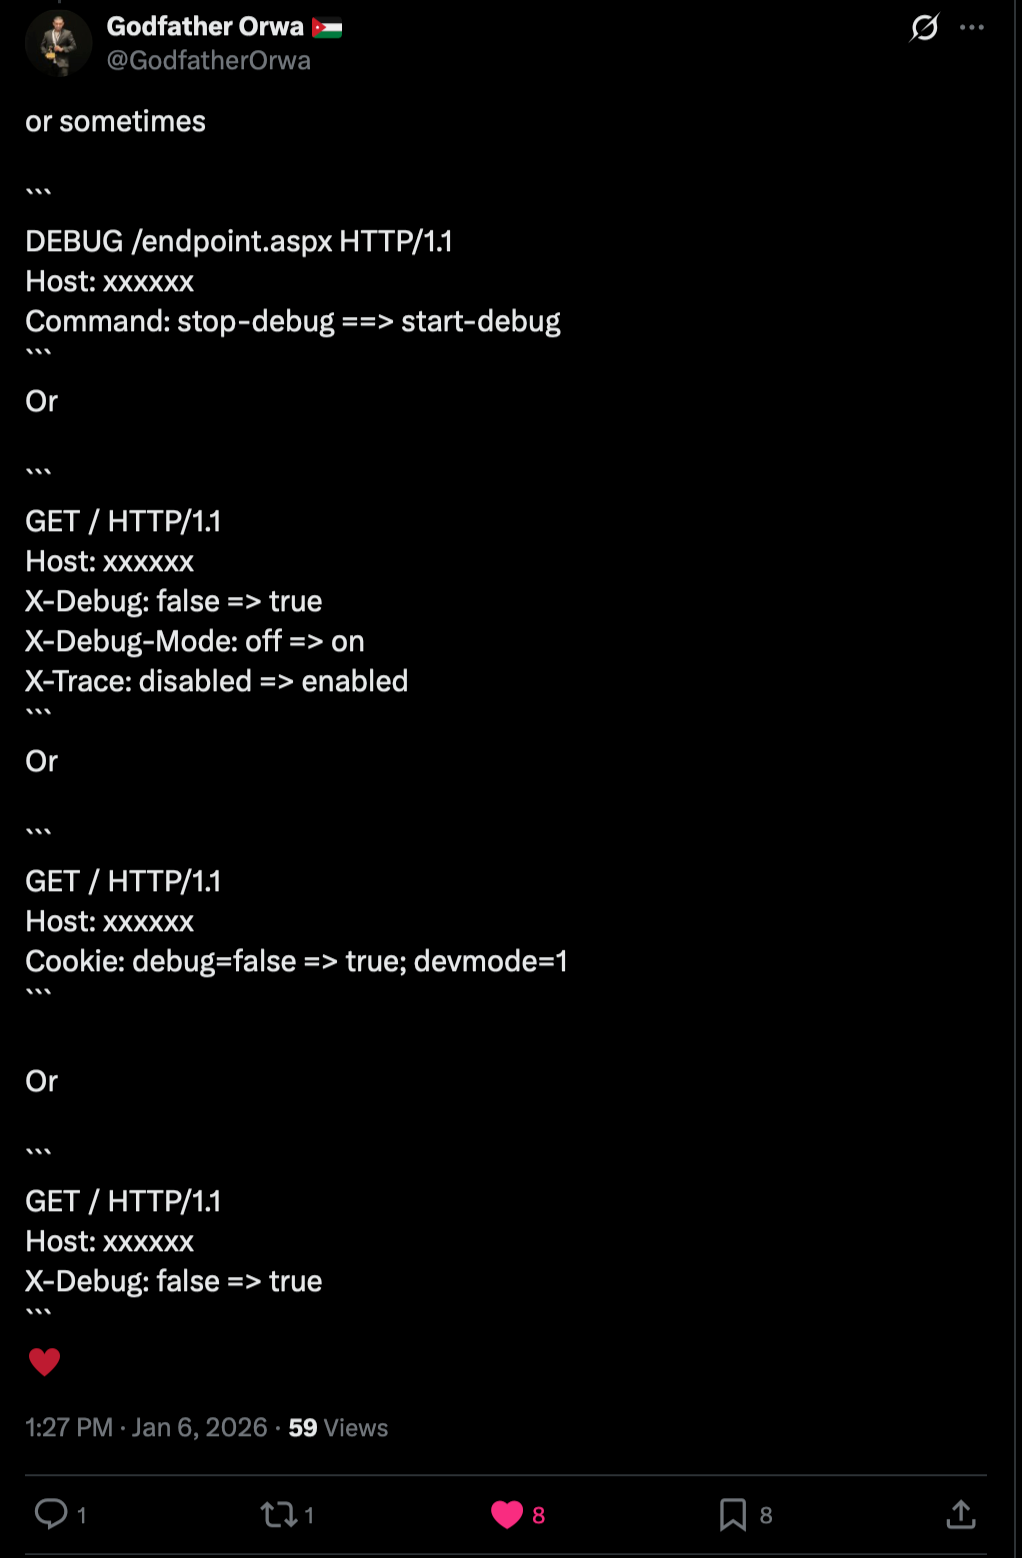
Active Discovery of Stack Traces
Malformed HTTP requests and input data are some of the most common ways to cause a stack trace . Some of the tricks I stumbled upon that cause them are :
1- Origin tampering
sometimes changing the origin from a whitlisted one to a random origin or a malformated one causes a stack trace error
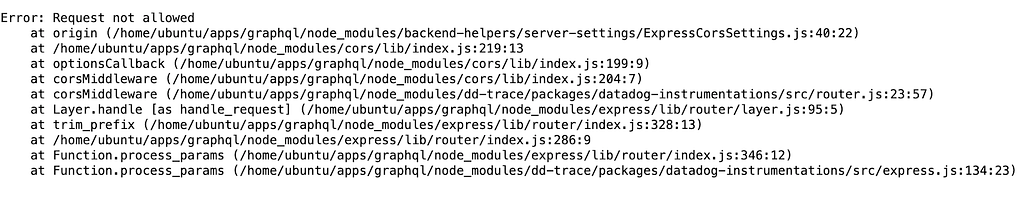
2. Invalid Input (Logic Violations)
Examples: • Numbers where strings are expected • Negative values where only positives make sense • Extremely large integers • Unicode where ASCII is assumed
Characters to inject:
' " < > { } [ ] ( ) ; : | & % $Also test: • Empty inputs • Missing required fields • Fields duplicated multiple times • Inputs exceeding normal size limits
These often reveal: • Parsing libraries • Validation order • Backend language
3- Invalid Content-Length
While intercepting traffic using Burp , provoking a simple mismatch in content-length and the actual length could cause the app to throw some errors or a timeout
4- Tampering with Cookies
injecting unexpected input in cookies and or adding additonal unexistant cookies could allow us to cause the app to error out
Test: • Invalid encoding • Oversized cookies • Unexpected cookie names • Modified session formats
Session deserialization errors often produce deep stack traces
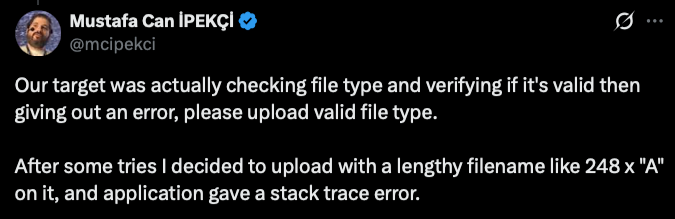
4- breaking File uploads logic
for example uploading invalid file types or unacceptable ones , as well as extremely large files …
How to Use Stack Traces for Exploitation
Once you get a stack trace, extract: • Language & framework • Exact library versions • File paths • Configuration hints • Database type • Third-party integrations
Then: • Look for known CVEs • Test framework-specific attacks • Abuse internal endpoints referenced in traces • Pivot into auth bypass, deserialization, or RCE
A stack trace is rarely the vulnerability its rather an entry point.
Hope you enjoyed reading this one . see ya !!